
Sherloq - Collaborative SQL Repository for Data Analysis
| Added on: | Jun 23, 2024 |
| Monthly Visits: | 11.73K |
| Social & Email: | -- |

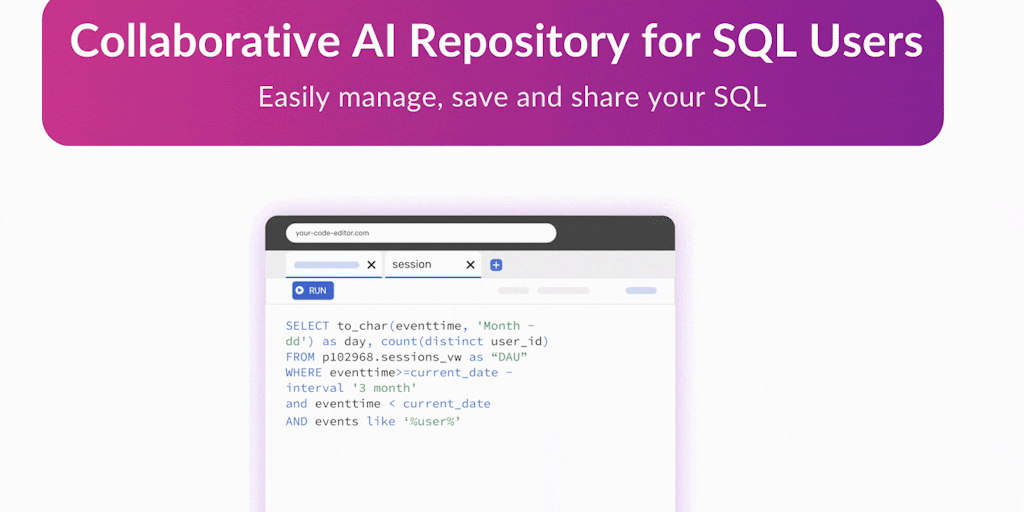
What is Sherloq
Sherloq is a collaborative data platform that helps teams to work together on data projects. It's designed for data scientists, analysts, and engineers who need to share data, collaborate on projects, and build models together. Sherloq's key features include data version control, collaboration tools, and a visual interface for building and deploying models. Sherloq's innovative approach to data collaboration makes it easier for teams to work together on data projects, which can lead to faster results and better outcomes. Sherloq's features can help to streamline the data workflow and improve data quality. For example, data version control allows teams to track changes to data over time and revert to previous versions if necessary. Collaboration tools allow team members to communicate and share data easily. Sherloq's visual interface makes it easy to build and deploy models, even for users who are not familiar with coding. Sherloq is a powerful tool that can help organizations to get more value from their data.
Core Features of Sherloq
Collaborative Data Exploration
Sherloq is a collaborative data exploration platform. It allows users to work together on data projects and share their insights.
Data Visualization
Sherloq provides a variety of tools for data visualization, making it easy to understand and share your data.
Data Analysis
Sherloq offers a suite of tools for data analysis, enabling users to perform advanced analysis tasks.
Data Governance
Sherloq helps organizations manage their data by providing tools for data governance.
Data Security
Sherloq offers a range of security features to protect your data.
FAQs of Sherloq
What is Sherloq?
Sherloq is a new generation of collaborative data exploration and analysis platform that helps teams work together to discover insights and make better decisions. It's like having a bunch of your friends working together on a giant spreadsheet, but with more powerful tools and features.
How does Sherloq work?
Sherloq uses a powerful combination of artificial intelligence (AI) and collaboration features to help you find the answers you need from your data. You can upload your data, use Sherloq's AI-powered tools to explore it, and then share your findings with your team.
What are some of the key features of Sherloq?
Sherloq has a lot of features that make it a great tool for data exploration and analysis. Here are just a few:
- AI-powered data exploration: Sherloq uses AI to help you find the insights that are hidden in your data. It can suggest relationships between your data points, identify outliers, and even create visualizations for you.
- Collaborative data analysis: Sherloq makes it easy to share your data and findings with your team. You can collaborate on projects, create dashboards, and even leave comments on each other's work.
- Powerful data visualization: Sherloq lets you create stunning visualizations of your data. You can use these visualizations to communicate your findings to others or simply to get a better understanding of your data yourself.
How is Sherloq different from other data exploration and analysis tools?
Sherloq is different from other data exploration and analysis tools because it combines AI with collaboration features. This makes it easier to find insights in your data and share them with your team. Other tools might be more focused on one or the other, but Sherloq is the best of both worlds!
Who is Sherloq for?
Sherloq is for anyone who works with data. This includes business analysts, data scientists, marketers, and anyone else who needs to make data-driven decisions.
How can I get started with Sherloq?
You can get started with Sherloq by signing up for a free trial on the Sherloq website. You can also explore the many resources available on the website, such as tutorials and documentation.
Sherloq Website Traffic Analysis
Latest traffic information
- Monthly Visits11.73K
- Bounce Rate38.08%
- Pages Per Visit1.92
- Visit Duration00:00:41
- Global Rank2M
- Country/Region Ranking1.35M
Visits Over Time
Top Keywords
| Keyword | Traffic | Volume | Cost Per Click |
|---|---|---|---|
| sgl eomonth | 190 | 220 | -- |
| extract (year from date) sql | 120 | 130 | -- |
| look for results in ayear using date columnb swql | 110 | 110 | -- |
| shareloq | 90 | 100 | -- |
| how to add upper case letters in sql when searching | 60 | 90 | -- |
Top Regions
| Region | Percentage |
|---|---|
| United States | 28.21% |
| India | 16.09% |
| United Kingdom | 12.92% |
| Germany | 9.34% |
| Poland | 9.28% |
