
MiniValuator
MiniValuator is a free DCF and PE stock valuation tool.

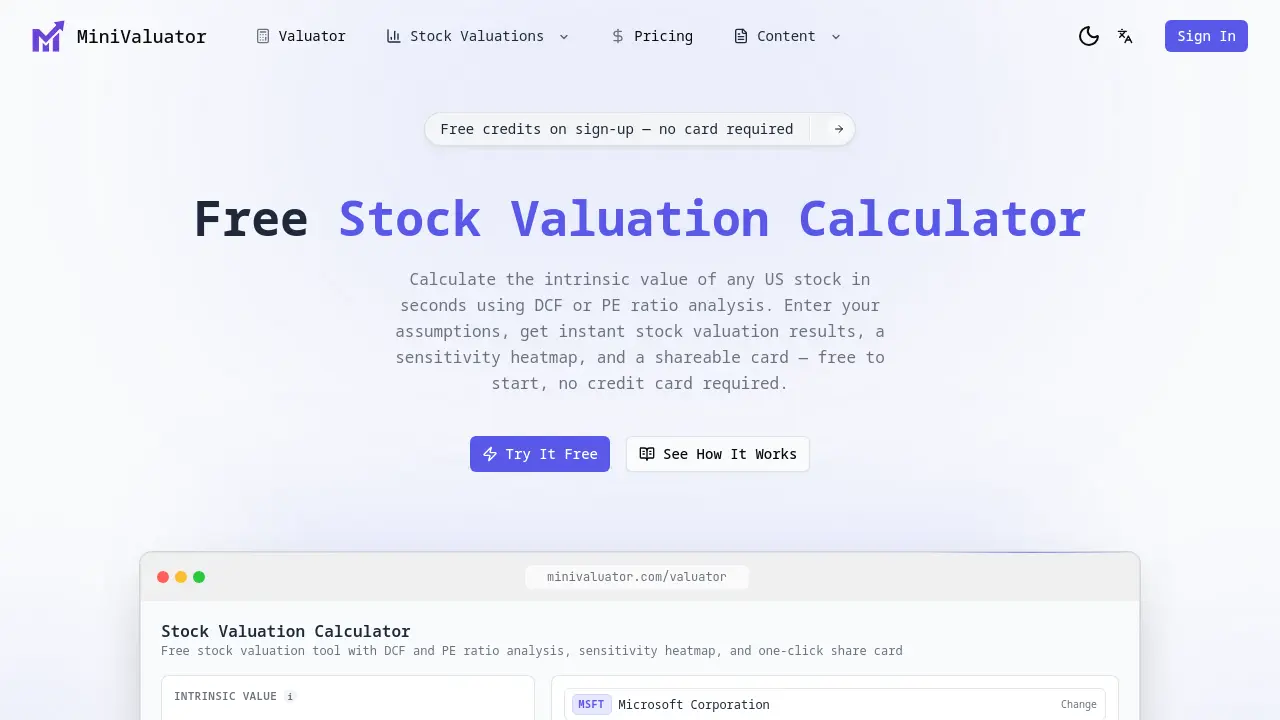
What is MiniValuator
MiniValuator is a minimalist stock valuation tool that simplifies intrinsic value calculation for US equities. It supports both discounted cash flow (DCF) and price-to-earnings (PE) ratio methodologies, enabling users to input assumptions like growth rates and discount rates. Real-time calculation updates results instantly, while a sensitivity heatmap visualizes valuation ranges across varying WACC and terminal growth scenarios. Financial data auto-fills from market estimates, with one-click resets for custom inputs. Outputs include margin of safety metrics and exportable PNG share cards, optimized for social media and investment reports. The platform operates freely without requiring a credit card and offers full UI support in English and Chinese, catering to a global investor base seeking efficient, spreadsheet-free analysis.
How does MiniValuator work
MiniValuator is a web-based stock valuation tool that computes intrinsic value using Discounted Cash Flow (DCF) and Price-to-Earnings (PE) ratio methodologies. Users input assumptions such as growth rates, discount rates (WACC), and terminal multiples; the system performs real-time calculations without page reloads. The tool auto-fills key financial data from market sources for US stocks, allowing overrides. A core feature is the sensitivity heatmap, which visualizes valuation variance across ranges of growth rates and exit multiples. Results, including margin of safety, are exportable as shareable PNG cards. The interface supports English and Chinese, targeting retail value investors seeking streamlined analysis.
Benefits of MiniValuator
MiniValuator is a streamlined stock valuation tool providing DCF and PE ratio analysis to calculate intrinsic value and margin of safety. Its key benefit is the interactive sensitivity heatmap, which visualizes valuation outcomes across varying growth and discount rate assumptions. Financial data auto-fills from analyst estimates, eliminating manual entry. Users can export polished, shareable PNG cards complete with analysis and heatmaps. The tool is free to start with no credit card required and supports both English and Chinese interfaces, simplifying professional investment analysis for students and value investors.
Pros and Cons of MiniValuator
Pros
- Real-time DCF and PE ratio calculations.
- Auto-fills market data from analyst estimates.
- Includes a sensitivity heatmap for scenario analysis.
- Exports valuations as shareable PNG cards.
- Free access without requiring a credit card.
Cons
- Valuation limited to US-listed stocks only.
- Pre-filled data may restrict custom assumptions.
- No portfolio management or tracking features.
- Data accuracy depends on external source feeds.
- Lacks advanced financial modeling options.
Core Features of MiniValuator
Stock Valuation Calculator
Calculates intrinsic value per share using Discounted Cash Flow (DCF) or Price-to-Earnings (PE) ratio methods based on user-provided assumptions, providing core valuation metrics.
Sensitivity Analysis Heatmap
Generates a two-dimensional matrix visualizing how intrinsic value changes across varying discount rates (WACC) and terminal growth rates, illustrating valuation range and uncertainty.
Stock Data Auto-Fill
Automatically populates key financial inputs like free cash flow per share or earnings per share with market and analyst estimate data for selected US stocks.
Live Recalculation
Updates all valuation results, including intrinsic value and margin of safety, instantly and automatically whenever any input parameter is adjusted by the user.
Export Valuation Card
Saves the complete stock valuation analysis as a high-resolution PNG image, including results, key assumptions, and a sensitivity heatmap thumbnail for easy sharing.
Multi-Language Interface
Provides a fully localized user experience in both English and Chinese, specifically designed to serve the global Chinese-speaking investment community.
Use Cases of MiniValuator
- Retail investors: Calculate intrinsic value and margin of safety for any US stock using DCF or PE ratio methods.
- Finance students: Learn stock valuation techniques through hands-on DCF and PE ratio analysis with real-time recalculation.
- Investment clubs: Compare multiple stocks and conduct scenario analysis using interactive sensitivity heatmaps.
- Financial bloggers: Export polished PNG valuation cards with intrinsic value and heatmap thumbnails for social media sharing.
- Individual analysts: Perform quick stock comparisons and assess valuation ranges with auto-filled market data inputs.
FAQs of MiniValuator
What is stock valuation?
Stock valuation is the process of estimating a company's intrinsic value, representing its true underlying worth based on fundamentals. Methods like discounted cash flow (DCF) analysis and price-to-earnings (PE) ratio comparison are commonly used to determine if a stock's market price is undervalued or overvalued.
Who is this stock valuation tool for?
MiniValuator is designed for value investors, finance students, and individual analysts who need to perform professional-grade stock valuations without complex spreadsheet models. It simplifies the process for both experienced practitioners and those learning investment analysis.
Where does the financial data come from?
Financial data such as free cash flow per share, earnings per share, and analyst estimates are pre-filled from reputable market data providers and public filings. Users can override any input with their own assumptions for customized analysis.
What does the sensitivity heatmap show?
The sensitivity heatmap is a two-dimensional matrix that visualizes how the calculated intrinsic value changes across different assumptions for the discount rate (WACC) and terminal growth rate. It helps users understand the range of possible valuations under varying economic scenarios.
What export formats does the share card support?
The share card exports as a 1080x1080 pixel PNG image. This format is optimized for social media platforms like Twitter and Reddit, as well as for embedding in investment reports or sharing via messaging applications.
Is this stock valuation tool free to start?
Yes, MiniValuator offers free credits upon sign-up with no credit card required. This allows new users to run initial valuations and explore the tool's features, including DCF and PE ratio calculations, before any paid commitment.
How accurate is stock valuation with DCF?
DCF valuation accuracy is highly dependent on the reasonableness of input assumptions, such as long-term growth rates and discount rates. It provides a theoretical intrinsic value estimate based on projected cash flows and should be used with a margin of safety, not as a guaranteed prediction.
How do DCF and PE ratio valuation methods differ?
The DCF method estimates intrinsic value by discounting projected future free cash flows to present value, focusing on a company's cash-generating potential. The PE ratio method compares a stock's current price to its earnings per share, offering a relative valuation against peers or historical averages. DCF is absolute and forward-looking, while PE is relative and based on past or current earnings.
What are the key inputs required for a DCF valuation?
Key DCF inputs include free cash flow per share (FCF), the forecasted growth rate for the projection period, the discount rate (often WACC), and the exit terminal value multiple. Each input significantly influences the final intrinsic value calculation.
How is the Margin of Safety percentage calculated?
The Margin of Safety percentage is calculated as: (Intrinsic Value per Share - Current Market Price) / Current Market Price × 100. A positive percentage suggests potential undervaluation, while a negative percentage indicates the stock may be overvalued relative to the intrinsic value estimate.
Can MiniValuator be used for non-US stocks?
MiniValuator currently supports valuation for US-listed stocks (NYSE, NASDAQ). The tool's data pre-fill and calculation frameworks are optimized for US equity markets and may not have reliable data for non-US listings or foreign exchanges.
Does MiniValuator provide real-time stock price updates?
MiniValuator does not provide live, real-time market price feeds. The current market price is pre-filled from the latest available closing data. For the most up-to-date valuation, users must manually input the current market price before running an analysis.
How to use MiniValuator
MiniValuator is a web-based tool for calculating the intrinsic value of US stocks using Discounted Cash Flow (DCF) or Price-to-Earnings (PE) ratio methods. It provides real-time results, sensitivity analysis, and shareable output cards.
- Navigate to the tool's main page via the provided URL to access the valuation interface.
- Select a specific US stock ticker or input it manually, then choose either the DCF or PE ratio valuation method.
- Review the pre-filled financial assumptions, such as Free Cash Flow per share or EPS, which are sourced from market analyst data.
- Adjust the key model inputs, including the growth rate, discount rate (WACC), and terminal exit multiple, to reflect your personal projections.
- Observe the automatic recalculation of the intrinsic value per share and the derived margin of safety against the current market price.
- Examine the generated sensitivity heatmap, which visually represents how the intrinsic value changes across different growth and discount rate scenarios.
- Use the one-click export function to generate a standard PNG image card containing the full valuation summary and heatmap thumbnail.
- Save or share the exported card directly for social media, investment reports, or collaborative discussion with your investing community.
MiniValuator Website Traffic Analysis
Latest traffic information
- Monthly Visits2.79K
- Bounce Rate51.69%
- Pages Per Visit1.1
- Visit Duration00:00:01
- Global Rank6.9M
- Country/Region Ranking4.06M
Visits Over Time
Top Keywords
| Keyword | Traffic | Volume | Cost Per Click |
|---|---|---|---|
| bkr stock intrinsic value | 150 | -- | -- |
| minivaluators | 10 | 190 | -- |
| avgo | -- | 271.38K | $1.22 |
| p/e ratio | -- | 34.74K | $0.4 |
| consumer cyclical | -- | 1.08K | $1.73 |
Top Regions
| Region | Percentage |
|---|---|
| Türkiye | 61.46% |
| United States | 31.72% |
| Canada | 6.81% |
